> For the complete documentation index, see [llms.txt](https://docs.hivesql.io/llms.txt). Markdown versions of documentation pages are available by appending `.md` to page URLs; this page is available as [Markdown](https://docs.hivesql.io/tutorials/hivesql-for-microsoft-excel.md).
# HiveSQL for Microsoft Excel
This step*-*by-step tutorial will show how to use Microsoft Excel to retrieve data from the HiveSQL database and present your result in a simple but nice pivot chart.
#### Writing a SQL query
Let’s say for example you want to see how many transactions have been issued each month on the blockchain. The SQL query to get such information will be:
```
SELECT
YEAR(Blocks.timestamp) AS [Year],
MONTH(Blocks.timestamp) AS [Month],
COUNT(*) AS [Transactions]
FROM
Transactions
INNER JOIN Blocks ON Transactions.block_num = Blocks.block_num
GROUP BY
YEAR(Blocks.timestamp),
MONTH(Blocks.timestamp)
```
**Retrieving data with Excel**
*Start Excel, go to the Data tab and select SQL Server as your data source*
*The Data Connection Wizard will be displayed*
*Enter the connection information in the wizard dialog box as shown and click "Next"*
{% hint style="info" %}
*Use your **HiveSQL account** login and password (see* [*Register your HiveSQL account*](/register-your-hivesql-acount.md)*)*
{% endhint %}
*Select any table (it doesn’t matter at this stage) and click '"Finish" to close the wizard*
*Click on* *"Properties"*
*Select the "Definition" tab and* c*heck the "Save Password" checkbox to avoid Excel asking you for credentials each time you connect to the database.*

*You can safely ignore the warning if your computer is secure*
*Open the "Command type" dropdown control and select "SQL"*
*Paste your SQL query and click* `OK`
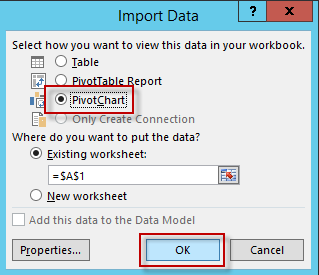\
\&#xNAN;*Select the type of data presentation you want in Excel.*
#### Finalizing the presentation
Now that you got all your data, make a nice chart.
*Organize your data fields in the pivot properties*

You now have created your report using the blockchain data.